
As organizations increasingly rely on Microsoft Graph to power their apps and services, understanding which applications are tapping into this powerful API becomes essential for security, governance, and optimization. That’s where the Graph API Usage Report Script steps in—a PowerShell-based solution designed to give administrators clear visibility into Graph API consumption across their tenant.
A good use case for this script is to track down which applications are making excessive API calls, potentially leading to throttling issues or security concerns. By identifying these applications, you can take proactive measures to optimize their usage or investigate unauthorized access. See this post for more details on Managing 429 Errors (throttling) in Microsoft Graph API.
This script not only tracks API usage but also resolves application GUIDs into human-readable names, making it easier to identify which apps are making calls to Microsoft Graph. Whether you’re an admin looking to audit app activity or a developer wanting to optimize your API calls, this tool is invaluable.
🚀 What Does the Script Do?
The script leverages the beta getApiUsage endpoint of Microsoft Graph to generate a detailed report of API usage. It retrieves raw usage data and enriches it by resolving application GUIDs into human-readable names—making the data both actionable and admin-friendly.
Whether you’re troubleshooting unexpected API spikes, auditing third-party integrations, or simply trying to understand your app landscape, this script delivers the insights you need.
📋 Prerequisites
Clone this repository to get started:
https://github.com/mjfusa/get-graphapi-usage
Required Permissions
The script requires the following Microsoft Graph API permissions:
Reports.Read.All- To read usage reportsApplication.Read.All- To read application informationDirectory.Read.All- To read directory information
Required User Roles (for Microsoft Entra)
- Reports Reader
- Global Reader
🛠️ Key Components
Install-Prerequisites.ps1
Before diving into usage tracking, you’ll need to ensure your environment is ready. The Install-Prerequisites.ps1 script installs the necessary Microsoft Graph PowerShell SDK modules:
| |
These modules enable authentication, application metadata retrieval, and access to usage reports—everything the main script depends on.
Get-GraphAPIUsage.ps1
This is the main script that does the heavy lifting. Here’s what it brings to the table:
- ✅ Authentication Prompt: Secure sign-in with required permissions (
Reports.Read.All,Application.Read.All,Directory.Read.All) - 📊 Usage Data Retrieval: Pulls usage metrics from the Graph API
- 🧠 App Name Resolution: Translates App IDs into recognizable names
- 🧾 Flexible Output: View results in the console or export to CSV
- 🧮 Summary Stats: Provides a quick overview of usage patterns
- 🛡️ Error Handling: Gracefully manages permission issues, missing data, and API hiccups
- ⚡ Caching: Reduces redundant API calls by storing resolved app names during execution
Example Usage:
| |
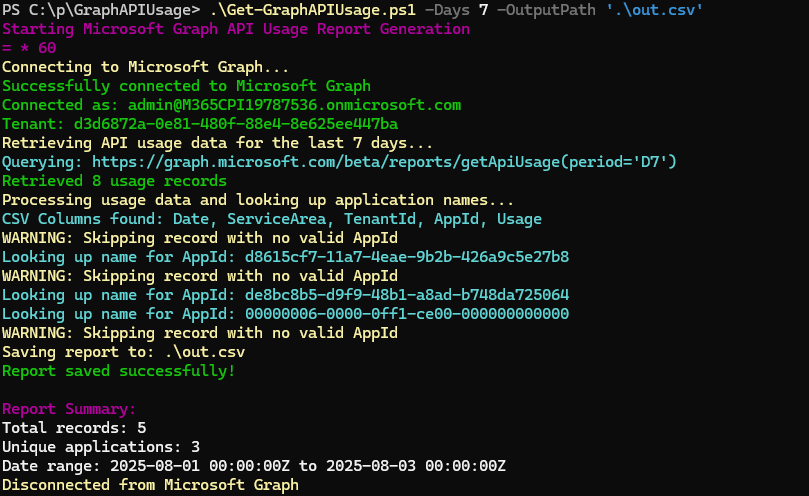 This command fetches the last 7 days of usage and saves the report to a CSV file.
📁 Output Snapshot
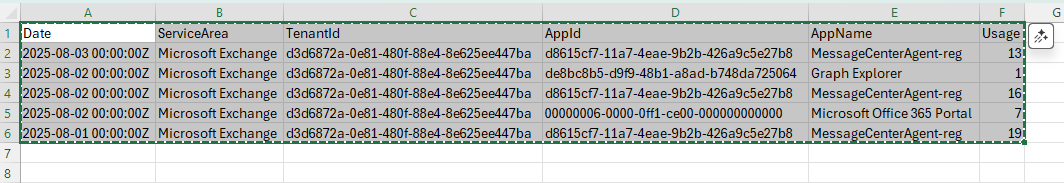
The report includes the following columns:
- Date – When the API call occurred
- ServiceArea – The Graph service area (e.g., Microsoft365, AzureAD)
- TenantId – Your tenant’s unique identifier
- AppId – The GUID of the calling application
- AppName – The resolved name of the application
- Usage – Number of API requests made
Example:
| |
Display in Excel
To visualize the data, you can easily open the CSV in Excel. This allows for quick filtering, sorting, and analysis of API usage patterns.
Here is the CSV data displayed in Excel:
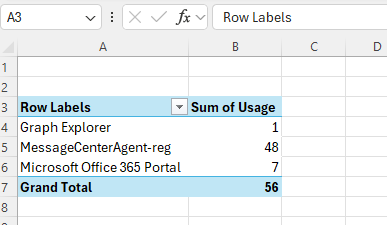
You can create pivot tables to summarize usage by application, service area, or date, helping you identify trends and anomalies at a glance.
Here is an example of a pivot table summarizing API usage by application:
✅ Summary of Key Benefits for Admins
- 🔐 Improved Security Oversight: Identify unauthorized or excessive API usage
- 📋 Audit Readiness: Easily track which apps are accessing sensitive data
- 📈 Performance Optimization: Spot usage trends and optimize resource allocation
- 🧩 Integration Clarity: Understand how internal and third-party apps interact with Microsoft Graph
- 🧠 Informed Decision-Making: Use data to guide licensing, permissions, and app lifecycle management
📝 Conclusion
In this post, we’ve explored how to track Microsoft Graph API usage using PowerShell. By leveraging the Microsoft Graph PowerShell SDK, we can easily authenticate, retrieve usage data, and generate insightful reports. The key benefits for admins include improved security oversight, audit readiness, performance optimization, integration clarity, and informed decision-making.
By implementing the provided scripts and techniques, you can gain a deeper understanding of how your organization interacts with Microsoft Graph and make data-driven decisions to enhance your security posture and resource allocation.
Happy scripting!